To use climate data to find the least efficient times of day, start by gathering reliable sources like NOAA. Track key metrics such as temperature and humidity. Identify when energy consumption spikes, noting patterns related to high temperatures. Schedule energy-heavy tasks during cooler times, like early morning or late evening, to reduce waste. By analyzing this data, you can make smarter decisions. You’ll soon discover even more ways to optimize your daily activities for energy efficiency.
Key Takeaways
- Collect reliable climate data from sources like NOAA, focusing on temperature, humidity, and solar radiation at various times of day.
- Analyze energy consumption patterns to identify peak usage times and their correlation with climate conditions, especially high temperatures and humidity levels.
- Graph visual representations of climate data to easily spot trends in energy use related to specific weather conditions throughout the day.
- Schedule energy-intensive activities during cooler periods, such as early mornings or late evenings, to maximize efficiency and reduce waste.
- Engage with your community by sharing insights on climate data to promote collective efforts in shifting activities to more efficient times.

Understanding how to use climate data can transform your approach to environmental issues. When you grasp how climate patterns change throughout the day, you can identify the least efficient times to engage in various activities. This knowledge isn’t just for scientists; it’s something you can apply in your daily life, whether you’re trying to save energy or make smarter decisions about resource use.
Start by collecting relevant climate data from reliable sources. Look for data that tracks temperature, humidity, and solar radiation at different times of the day. You can find this information on websites like NOAA or your local meteorological service. Once you have your data, immerse yourself in data analysis. Use tools like spreadsheets or data visualization software to graph climate patterns over time. This will give you a clear picture of how conditions fluctuate.
Next, focus on specific times of day when energy consumption spikes. For instance, consider when the temperature is highest and when cooling systems work harder. If you notice that energy use peaks in the late afternoon, you can analyze the corresponding climate data to determine if high temperatures are the driving factor. Similarly, if humidity levels rise in the morning, you might find that certain activities—like using power-hungry appliances—are less efficient during that time. Recognizing climate variability can help you anticipate these fluctuations more accurately. Being aware of daily climate fluctuations enables you to plan activities more effectively and reduce waste. Additionally, understanding climate data trends**** can help you predict future patterns and prepare accordingly.
As you sift through the data, pay attention to trends. Are there consistent patterns in energy use related to climate conditions? Perhaps you’ve discovered that people tend to use more electricity during the hottest part of the day. By identifying these trends, you can adjust your habits. For instance, you might decide to run your dishwasher or laundry machines in the early morning or late evening when it’s cooler and energy demand is lower.
Incorporating climate data into your decision-making process can also help you engage with others. Share your findings with friends, family, or community members. Encourage collective action, like shifting community events or activities to times that won’t strain energy resources. This not only minimizes waste but also raises awareness about climate issues. Recognizing the importance of climate data analysis can further empower you to make environmentally conscious choices.
In essence, using climate data effectively allows you to make informed choices that can lead to significant environmental benefits. By understanding the least efficient times of day through careful data analysis, you can contribute to a more sustainable future while also optimizing your own resource use.
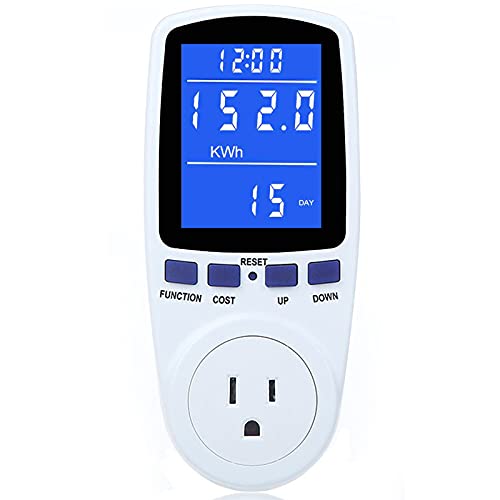
Upgraded Watt Power Meter Plug Home Electrical Usage Monitor Consumption, Energy Voltage Amps Kill Tester with Backlight, Overload Protection, 7 Modes Display
- Multiple Monitoring Parameters: Displays power, energy, volts, amps, and more
- Large Backlit LCD Screen: Clear data display with wide viewing angles
- Adjustable Backlight Duration: Set backlight time from 10 minutes to always on
As an affiliate, we earn on qualifying purchases.
As an affiliate, we earn on qualifying purchases.
Frequently Asked Questions
What Tools Can I Use to Analyze Climate Data Effectively?
To analyze climate data effectively, you can use data visualization tools like Tableau or Power BI to create clear graphics. Statistical software such as R or Python’s Pandas library helps you apply analytical techniques for deeper insights. Additionally, climate models in platforms like CMIP offer predictive capabilities. By combining these tools, you’ll enhance your understanding of climate patterns and make informed decisions based on the data you gather.
How Often Should I Update My Climate Data Analysis?
Updating your climate data analysis is like tending a garden—regular care guarantees growth. Aim to refresh your data frequency at least monthly; this keeps your insights relevant and actionable. However, adjust your analysis timing based on specific environmental changes or seasonal shifts. If you notice significant fluctuations, consider weekly updates. Staying proactive not only sharpens your understanding but also enhances decision-making, allowing you to respond effectively to evolving climate patterns.
Can I Combine Climate Data With Other Types of Data?
Yes, you can absolutely combine climate data with other types of data. By embracing climate data integration, you enhance your analysis and gain deeper insights. Consider incorporating data source diversity, like economic indicators or energy consumption statistics, to get a more thorough view. This combination can reveal patterns and relationships you might miss when looking at climate data alone, allowing you to make more informed decisions and strategies.
What Are Common Mistakes in Analyzing Climate Data?
When you analyze climate data, a common mistake is ignoring seasonal variations. For instance, if you sample data during a particularly unusually hot summer, you might misinterpret trends. Analysis bias can creep in if you rely on unreliable sources, so always check source credibility. Additionally, poor data visualization can obscure insights, while inadequate temporal resolution may lead you to overlook important fluctuations. Focus on these aspects to improve your analysis considerably.
How Do I Interpret Conflicting Climate Data Findings?
To interpret conflicting climate data findings, start by identifying data discrepancies among sources. Check for differences in methodology, timeframes, and sample sizes. Next, consider the interpretation challenges these discrepancies create. Look for patterns or commonalities that might provide clarity. It’s also helpful to consult experts or additional literature for insights. Ultimately, don’t rush to conclusions; allow the evidence to guide your understanding while remaining open to new interpretations.

ecobee Smart Thermostat Essential – WiFi Thermostat, Energy Star Certified
- Energy Savings: Save up to 23% annually on energy costs
- System Compatibility: Compatible with 85% of HVAC systems
- Easy Temperature Control: Adjust temperature via touchscreen or app
As an affiliate, we earn on qualifying purchases.
As an affiliate, we earn on qualifying purchases.
Conclusion
So, you’ve mastered the art of using climate data to pinpoint the least efficient times of day. Congratulations! Now, you can proudly embrace those moments when your productivity dips like a soggy biscuit in tea. Forget about sunshine and motivation; just blame the weather! After all, why aim for efficiency when you can revel in the joy of procrastination? So, grab that snack and let the clouds be your excuse—who needs sunlight when you’ve got data?
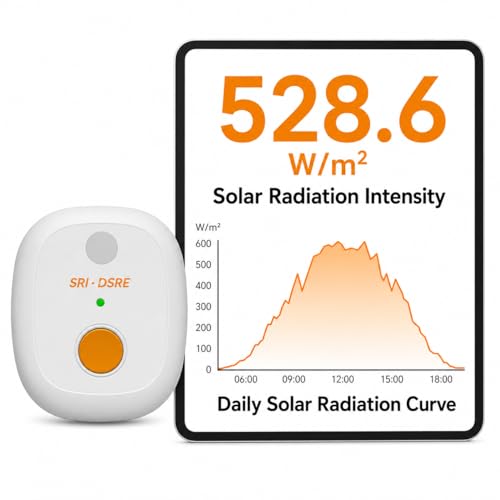
Solar Power Meter. Measures Solar Radiation Intensity & Daily Solar Radiation Energy, 180-Day Data Logging, Real-Time Graphs & CSV Export, Solar Irradiance Monitor
- Measures Solar Radiation & Energy: Tracks SRI and DSRE levels
- Real-Time Radiation Graphs: Displays live SRI curves in app
- Daily Solar Data Logging: Records and compares daily solar energy
As an affiliate, we earn on qualifying purchases.
As an affiliate, we earn on qualifying purchases.

USB Temperature Data Logger Recorder for Temperature Humidity and Atmospheric Pressure, IP65 Waterproof Temperature Logger with PDF and CSV Reports High Accuracy
- Real-Time Multi-Parameter Measurement: Records temperature, humidity, pressure simultaneously
- Wide Measurement Range: Temperature: -30°C to 70°C, Humidity: 0.1-99.9%, Pressure: 300-1100hPa
- Plug-and-Play USB Connection: No cables or drivers needed, compatible with Windows
As an affiliate, we earn on qualifying purchases.
As an affiliate, we earn on qualifying purchases.